Ties between flood mapping and the living shoreline

The Flood Map is an online, user-friendly tool that can help communities visualize different flooding events in their communities.

An online tool to help communities visualize different flooding scenarios

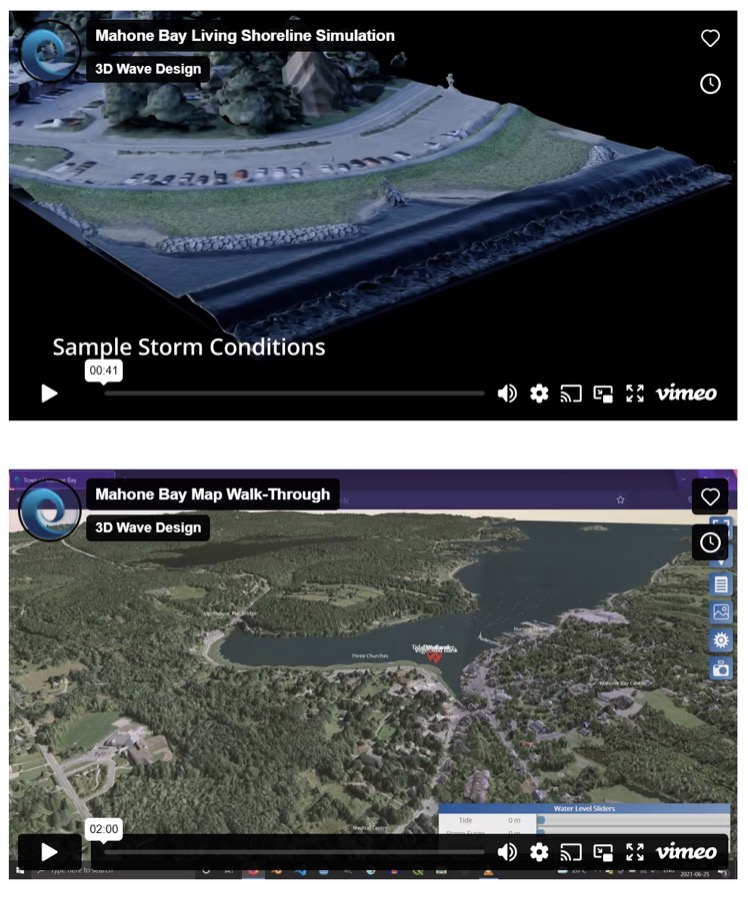
One neat feature of these tools is the ability to include conceptual designs, like the one for the “Mahone Bay Living Shoreline,” in the maps. This allows us to visualize how nature-based solutions can help mitigate the effects of coastal flooding. By adding the conceptual designs in the map and choosing the different water levels, you can see how the living shoreline helps reduce flooding on Edgewater Street.

Flood visualization tool

One of the key features of the flood maps is the ability to simulate the different flooding scenarios, adding in how climate change will affect flooding and help understand where flooding may occur. These visuals of how a flood could affect your community can help plan emergency preparedness, adaptation measures such as nature-based solutions and help homeowners make informed decisions around flood risk. In the maps, there are different timelines for flooding that we can choose from and different “year” events, but what does that exactly mean?

When looking into the future, over the years, we will have different amounts of sea level rise and storms that might occur due to climate change. This will influence the amount of flooding we will see along coastlines and within communities.

Flood levels and scenarios

An example of this, we often see the flooding levels, called also “scenarios”, for 20-year and 100-year storms. These years represent the average time that passes between flooding events of certain levels. Despite the name, these floods are not limited to occurring only every 20 or 100 years. These 20-year and 100-year events are useful to understand once we put them into perspective: What are the chances I will see these flood levels each year? In the maps, you can see the term “Annual Exceedance Probability” (AEP). These represent the percentage of risk of seeing these flood levels in any given year. And so, a 20-year event will have a probability of occurring 5% in any given year, while a 100-year event will have a probability of occurring 1% in any given year.

Interested in learning more about potential flooding scenarios in the Mahone Bay area of NS?
Access the interactive map here.

Launch the Mahone Bay 3D Project